Skip to content

Work · Geography in practice

Spatial systems people can explore and use.

My work connects enterprise GIS, public service, and independent applications. I build tools that make geographic information easier to investigate, explain, and put to work.

Three ways to look at a place.

Historical hazards, the geography of public-service requests, and the Pacific climate system. These are independent portfolio applications, not official services of the agencies that publish the underlying data.

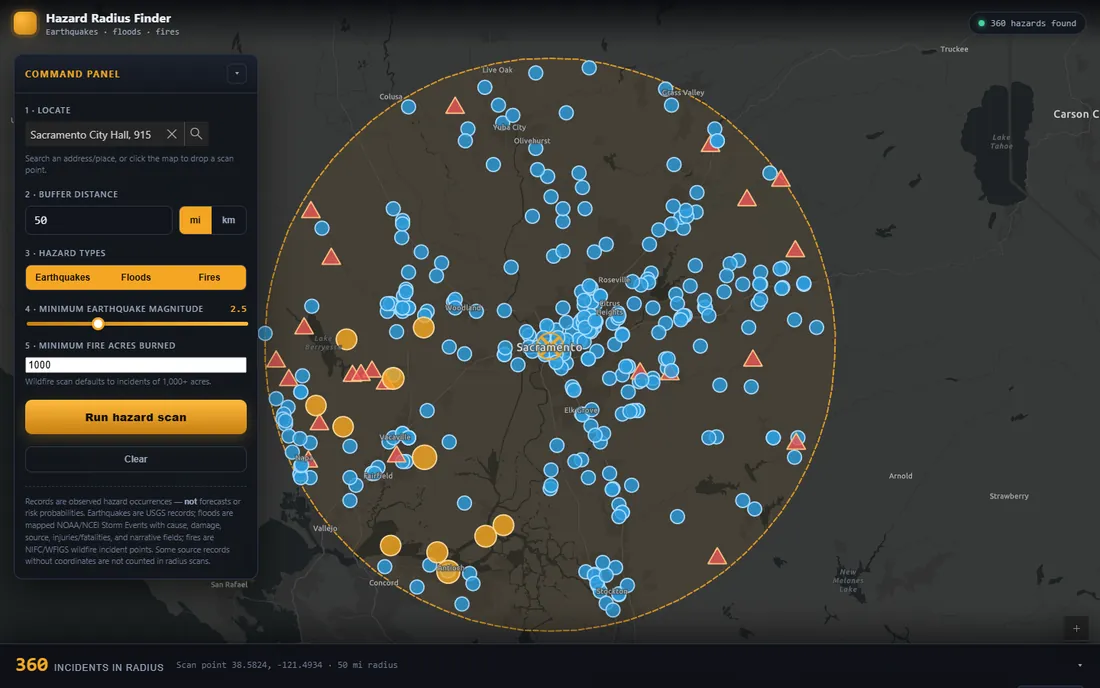
Hazard Radius Finder displaying historical incident markers within 50 miles of SacramentoView screenshot ↗
A 50-mile search around Sacramento, with earthquake, flood, and fire records shown together.

Independent project · My role: application design and development

Hazard Radius Finder

I built this map interface to investigate which historical hazards have been recorded near a chosen place. It starts with a location and a search radius, then brings several kinds of incident records into the same view.

Search for an address or choose a point on the map, set a distance, and filter earthquakes, floods, and fires. Earthquake magnitude and burned-area controls help narrow the results. Dated incident details and a CSV export make it possible to take a closer look at the records behind the map.

The map shows recorded occurrences. It does not forecast hazards or estimate the probability of future damage. Records without mapped coordinates are excluded, and the displayed and exported results are bounded.

Spatial searchPublic incident recordsMap interaction
Explore Hazard Radius Finder
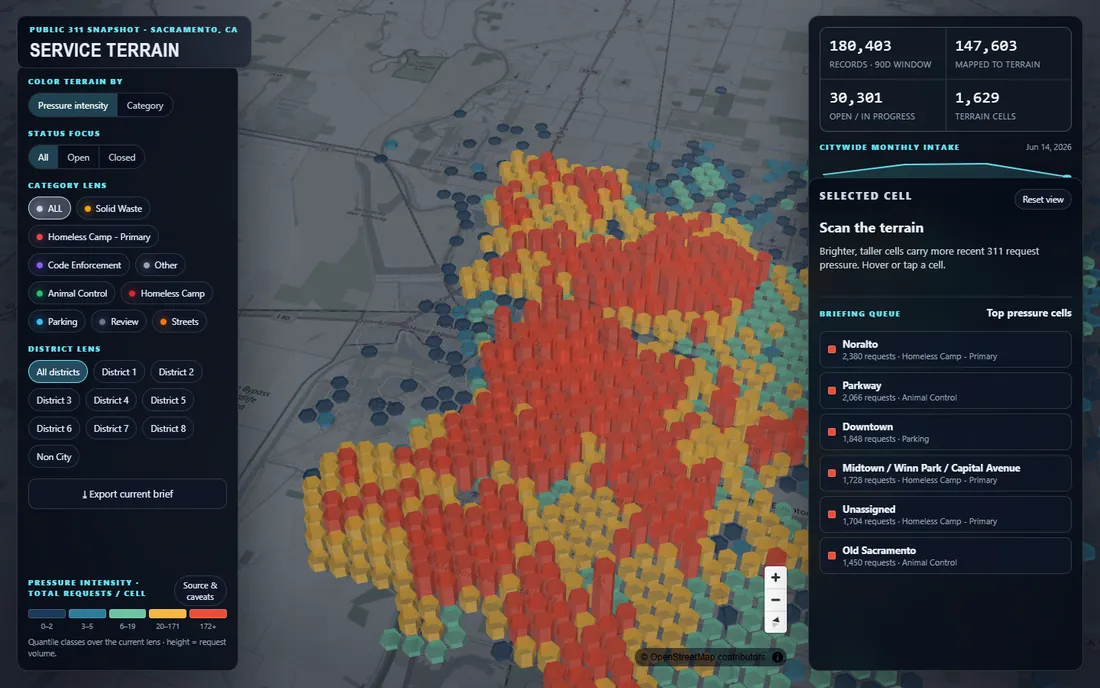
Sacramento Service Terrain showing a 3D surface of colored hexagonal columns representing 311 request volumeView screenshot ↗
Hexagonal columns turn a 90-day snapshot of Sacramento 311 requests into an explorable surface.

Independent project · My role: application design and development

Sacramento Service Terrain

To explore where recorded service-request activity concentrates, I built a 3D landscape of Sacramento’s 311 data. Column height represents request volume, while color helps reveal intensity or category.

Filter the surface by request category, status, or council district, then inspect individual cells. Small trend charts, a ranked briefing queue, and text export connect the visual pattern to a more detailed review. The interface gives a broad view of activity while keeping the selected area in focus.

This is a fixed 90-day snapshot assembled when the site was built. Height represents reports, not ground elevation, population, or verified need. It is not a live operational backlog; partial-month totals need to be read with their period labels.

3D cartography311 recordsExploratory analysis
Explore Sacramento Service Terrain
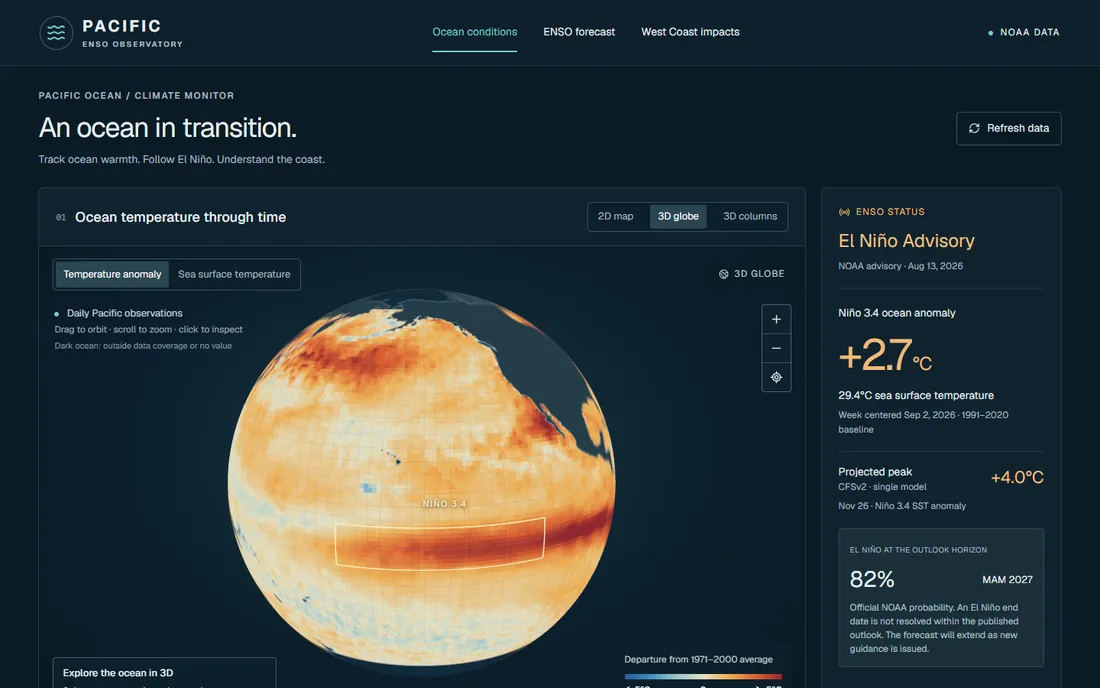
Pacific ENSO Observatory displaying ocean temperature anomalies on a 3D globeView screenshot ↗
A globe view of ocean temperature anomalies in the Pacific ENSO Observatory.

Independent project · My role: application design and development

Pacific ENSO Observatory

This project explores how a changing Pacific Ocean can become easier to understand. I brought ocean-temperature maps, El Niño–Southern Oscillation guidance, and seasonal West Coast context into a single geography-focused interface.

The observatory combines 2D and 3D ocean views with Niño 3.4 trends, CFSv2 forecast spread, and NOAA seasonal temperature and precipitation outlooks. Visitors can move between the spatial picture and the measurements and forecasts used to describe it.

Observation and forecast anomalies use different reference baselines. The spread from a single forecasting model is not a calibrated confidence interval, and a seasonal outlook is not a local weather forecast. Read each view alongside its source and period.

Climate geographyScientific visualization2D and 3D views
Explore Pacific ENSO Observatory

GIS inside working organizations.

Alongside independent development, my professional work has involved operational automation, enterprise architecture, and leading GIS teams.

City of Sacramento · GIS Specialist II · September 2016–June 2018

Making meter-route sequencing repeatable.

I developed and deployed a meter-route sequencing application using custom Python scripts and Esri Web AppBuilder. It addressed a recurring staff task and reduced staff time by three weeks per route.

The project brought automation and a web interface together in a workflow staff could use, within the City’s existing GIS environment.

PythonWeb AppBuilderOperational automation

Cal OES · Geospatial Architect · August 2021–October 2022

Coordinating GIS for emergency management.

I led the GIS and Data teams, built a team of seven GIS professionals, and coordinated a statewide emergency GIS data working group across departments and agencies.

My responsibilities included GIS architecture and statewide data and application initiatives: evacuation data, State Operations Center dashboards, and work supporting situational awareness, FIRIS, and Urban Search & Rescue. This was team and interagency work, with my role spanning technical leadership and delivery coordination.

GIS architectureTeam leadershipInteragency data

These examples describe work undertaken in my professional roles. The independently published applications above are separate projects.

See my experience and background

More projects and guides.

A wider selection of independent applications, reusable GIS workflows, and explanations of the systems behind them.

Public data · Permits

Sacramento Building Permits

A Python-generated monthly publication combining issued and finaled permit activity, narrative summaries, maps, charts, and sortable records. The reports describe monthly snapshots rather than live permit status.

Read the permit reports

Spatial context · Address search

Address Atlas California

An address-based view of parcel, zoning, Census, hazard, and selected permit information, with source references. Coverage follows the available sources and jurisdiction; permit and assessment detail is limited to supported Sacramento and Los Angeles sources.

Explore address context

Civic GIS · Street safety

Sacramento Street Safety Lab

A corridor explorer connecting crash summaries with mapped crashes, streetlights, detours, and traffic context. Select a corridor to produce a compact planning brief and examine the underlying sources and methods.

Explore the street-safety lab

GIS tools · Service discovery

AGOL Location Intersector

A workbench for finding public ArcGIS services that intersect a location or distance buffer, drawing matching features, and exporting an inventory. Discovery covers the queried services rather than every possible layer.

Explore the location workbench

GIS guides · AI workflows

Hermes GIS Skills

A versioned library of GIS workflow skills and supporting documentation, covering service validation, geospatial QA, map development, and delivery. The skills guide a configured agent; the GIS software and tools are connected separately.

Explore the GIS skill library

Guide · Knowledge systems

Local-First AI Vault Workflow

A guide to using an Obsidian vault as a working knowledge system with Hermes Agent. It explains the workflow and its components; the public guide does not expose the underlying personal vault.

Read the vault workflow guide

Have a geographic problem to work through?

I’m interested in GIS and AI projects, professional opportunities, and collaborations that connect useful tools with the people who use them.

Get in touch

Project screenshot